

On September 15, Treasury Secretary Scott Bessent told the House Financial Services Committee that "a new industrial supercycle is moving from investment into production, and from blueprints into paychecks." He had evidence behind him: the ISM survey has shown manufacturing growing for eight consecutive months, business activity is at a 52-month high, and the Atlanta Fed's tracker points to Q3 GDP growth above 4%. The same morning, the New York Fed's Empire State survey showed growth among New York manufacturers slowing sharply, with new orders barely positive, shipments slightly negative, and input prices rising at the fastest pace in years. By the close, the 10-year Treasury had touched 5.045% intraday, its highest level in 19 years. The next day, the Fed raised its policy rate a quarter point to 3.75-4.00%. The day after that, the Philadelphia Fed's September survey printed substantial activity and rising prices in the same release.
A reasonable person could read that week and conclude the supercycle is real. A reasonable person could read the same week and conclude manufacturers are heading into a tough couple of quarters. I think both readings are correct, and the interesting question sits underneath them: can the factories America has spent four years building produce competitively priced products at a profit? None of last week's releases can answer that, because the answer accumulates part by part, supplier by supplier, over the next several quarters. This post is about how I would keep score.
September Fed Surveys Show Growth Slowing and Prices Rising
The Empire State survey deserves a careful read before anyone builds a macro narrative on it. Here is what actually moved between August and September:
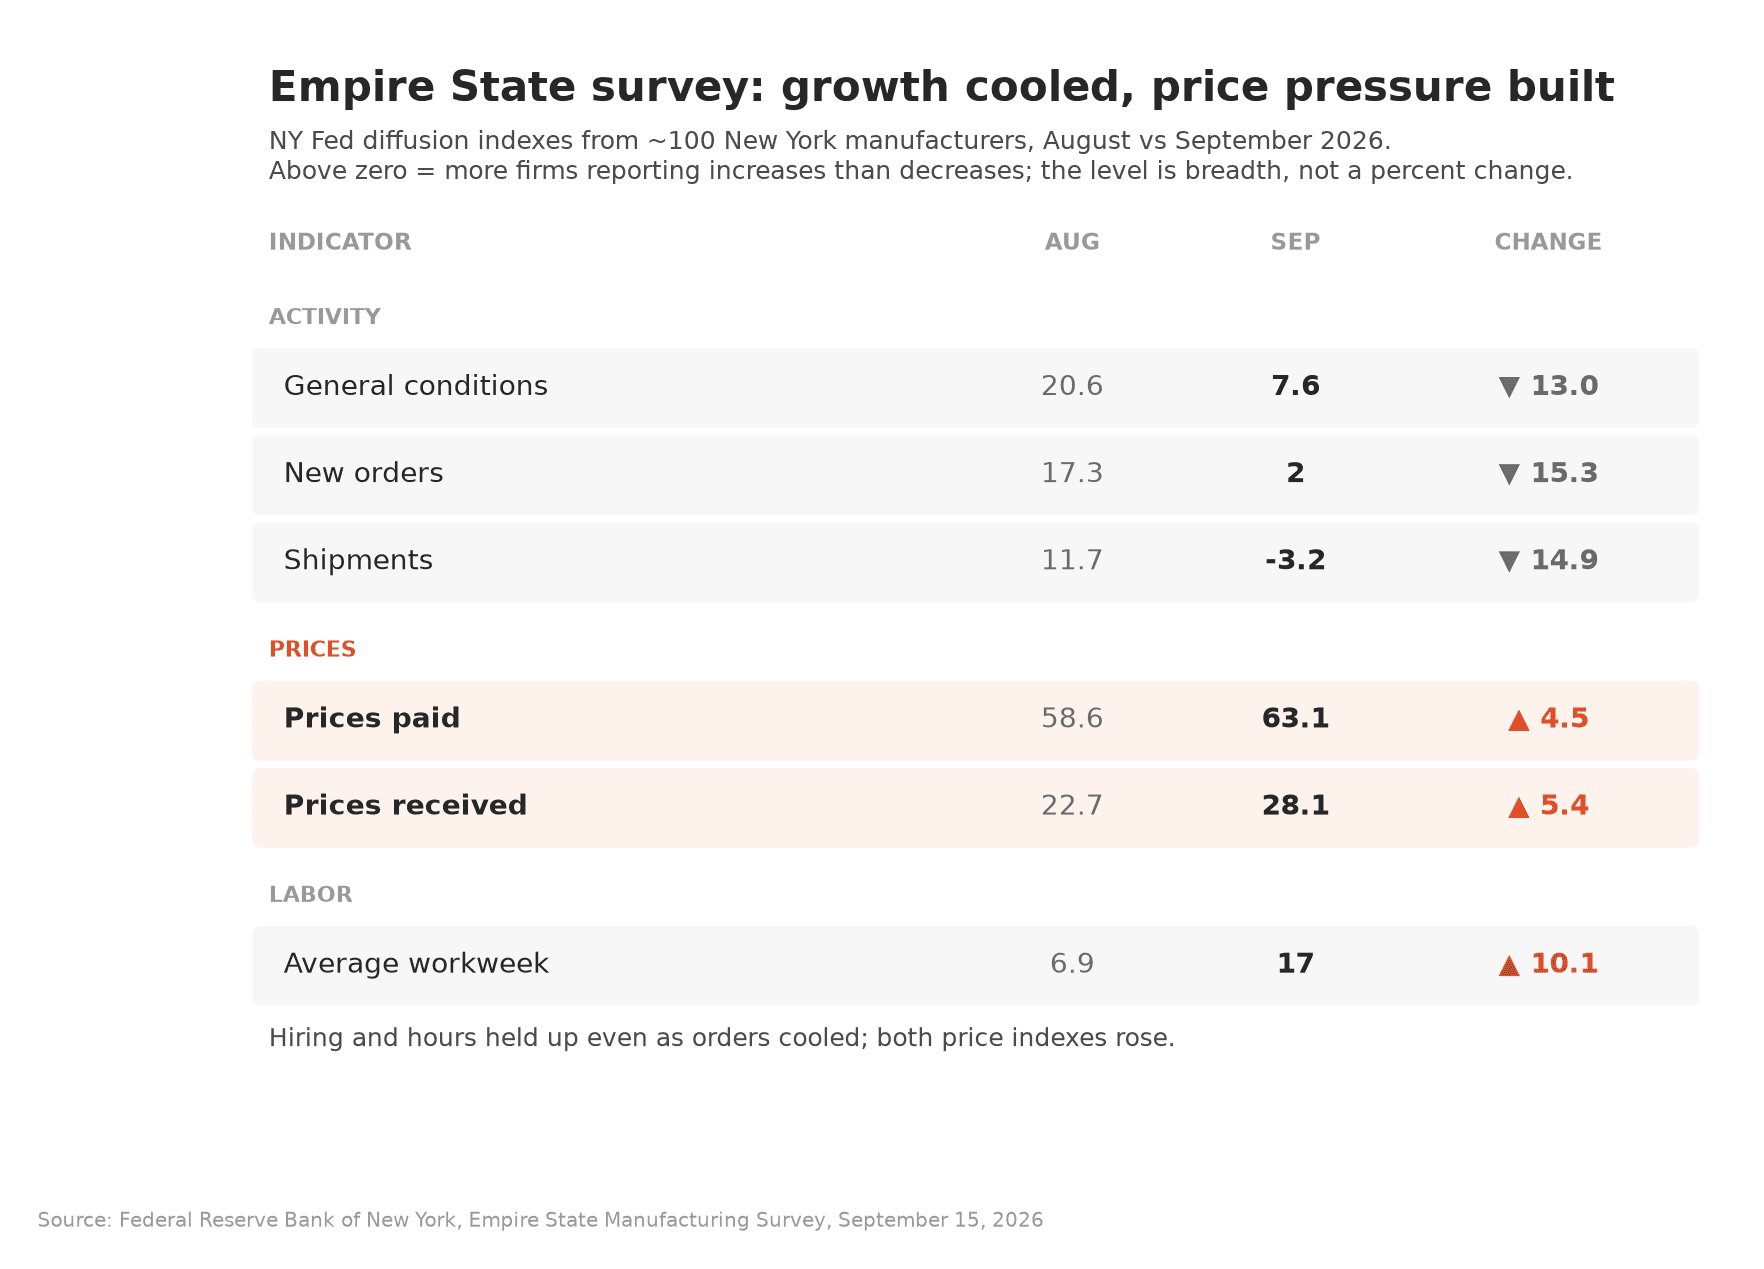
What moved in the September Empire State survey: activity indexes fell, both price indexes rose, hours held up -- Source: Federal Reserve Bank of New York (Sep 15, 2026)
These are diffusion indexes: they measure how many of roughly 100 surveyed New York manufacturers reported increases versus decreases, not how much anything changed. A reading of 7.6 means growth continued at a slower breadth, not that output fell 7.6%. And subtracting the prices-received index from the prices-paid index does not calculate anyone's margin -- diffusion indexes have no magnitudes, so establishing an actual margin effect requires financial data, not survey breadth. What the survey does say clearly: activity in one region cooled, hiring and hours held up, and far more firms are seeing input costs rise than fall.
The national picture is stronger than New York's. The August ISM Manufacturing PMI came in at 54.6, the eighth straight month above the 50 expansion threshold, with fifteen industries reporting growth -- though its prices index sat at 71.1, and the ISM composite gets a mechanical lift from slow supplier deliveries, which is friction rather than health. Philadelphia's September survey, released September 17, showed general activity at 37.8 with prices paid at 48.6. The honest summary across all three: the expansion is intact, its momentum is cooling, and cost pressure is broadening. That is a real mixed picture, not a contradiction to be argued away.
Factory Construction Peaked in 2024, but Production Keeps Rising
The investment side of the supercycle has already rolled over, and it is worth being precise about what that does and does not mean. Census data on manufacturing construction spending tells the whole arc: $97.9 billion (annualized) in January 2022, a peak of $250.2 billion in September 2024, and $169.8 billion as of July 2026. That is 32% below the peak and still 73% above where the boom started. Actual dollars spent from January through July 2026 ran 22% below the same period last year. Anyone quoting only one of those comparisons is selling you a narrative.
Falling construction spending is genuinely ambiguous. It can mean projects finished and moved into production, which supports Bessent's "investment into production" framing. LG Energy Solution's Lansing plant is the clean example: LG took full control of the former Ultium facility in May 2025, held its grand opening on August 18, 2026, and has a $4.3 billion agreement to supply Tesla with energy-storage cells built there -- an EV-era asset redirected toward storage demand. Or falling construction can mean projects died. The MIT-Rhodium Clean Investment Monitor counted $22 billion of EV-supply-chain manufacturing investment cancelled in 2025, more than the $21 billion in new announcements, and Intel has pushed its $28 billion Ohio campus out to 2030-31.
The production data leans toward Bessent, with caveats. Manufacturing output rose 1.2% year over year through July, and the composition matters: business-equipment output was up 6.6% while consumer-goods output was down 1.8%. The demand pulling factories forward right now is capex demand -- data centers, grid equipment, defense -- rather than household spending. Meanwhile, manufacturing capacity utilization sits at 76.0%, about two points below its long-run average, and the aggregate hides a wide spread: chemicals ran at 71.6% in July while nonmetallic mineral products ran at 82.6%. Spare capacity in one industry cannot produce the casting or certified component another industry needs, so "76% utilized" says very little about whether the specific qualified supplier you depend on has room for your volume. The GAO's August checkpoint on CHIPS Act implementation found $13.1 billion of $31.2 billion in direct funding actually disbursed -- real progress, and also a reminder that disbursement is not the same thing as commercial production.
Cancelled Plants vs. Record Order Books
The strongest bear case is concrete. Battery manufacturing alone saw $11 billion of cancelled investment in 2025, ten times the 2024 level, against just $8 billion in new announcements. T1 Energy scrapped its $2.5 billion Georgia cell plant; AESC paused a $1.6 billion South Carolina facility. Tariffs cut both ways in this story: they protect some domestic producers while raising input costs for everyone downstream. August producer prices for steel mill products were up 23.4% year over year, aluminum mill shapes up 27.3%, and copper and brass mill shapes up 20.9%. BCG's Daniel Kupper put the downstream problem bluntly: "Even the most efficient factories can't overcompensate for the impact from tariffs."
The strongest bull case is equally concrete. Deloitte puts the combined backlog of the three largest US defense primes at $557 billion, roughly 2.7 times their 2025 sales. The commercial aircraft backlog is around 14,000 planes -- close to a decade of production. BCG's September analysis projects nearly $6 trillion of US domestic investment between 2025 and 2029, with about 85% of it in data centers, AI compute, and electrification. Those are multiyear demand commitments, not sentiment readings -- although the same BCG team projects a shortfall of roughly 2 million skilled-trade workers by 2030 and adds the right qualifier: "But capital is the easy part."
Deere's August earnings show what it looks like when both cases apply to one company. The company raised its full-year net income guidance to $4.75-5.0 billion on an 18% jump in construction-and-forestry sales, and its investor relations team noted that "customer backlogs now extend well into fiscal year 2027." The same call projected roughly $750 million in net tariff costs for 2026 and $1 billion for 2027. The demand side of Deere's business is in excellent shape; whether the cost side lets it keep the margin on that demand is the open question. That is the entire supercycle debate compressed into a single income statement.
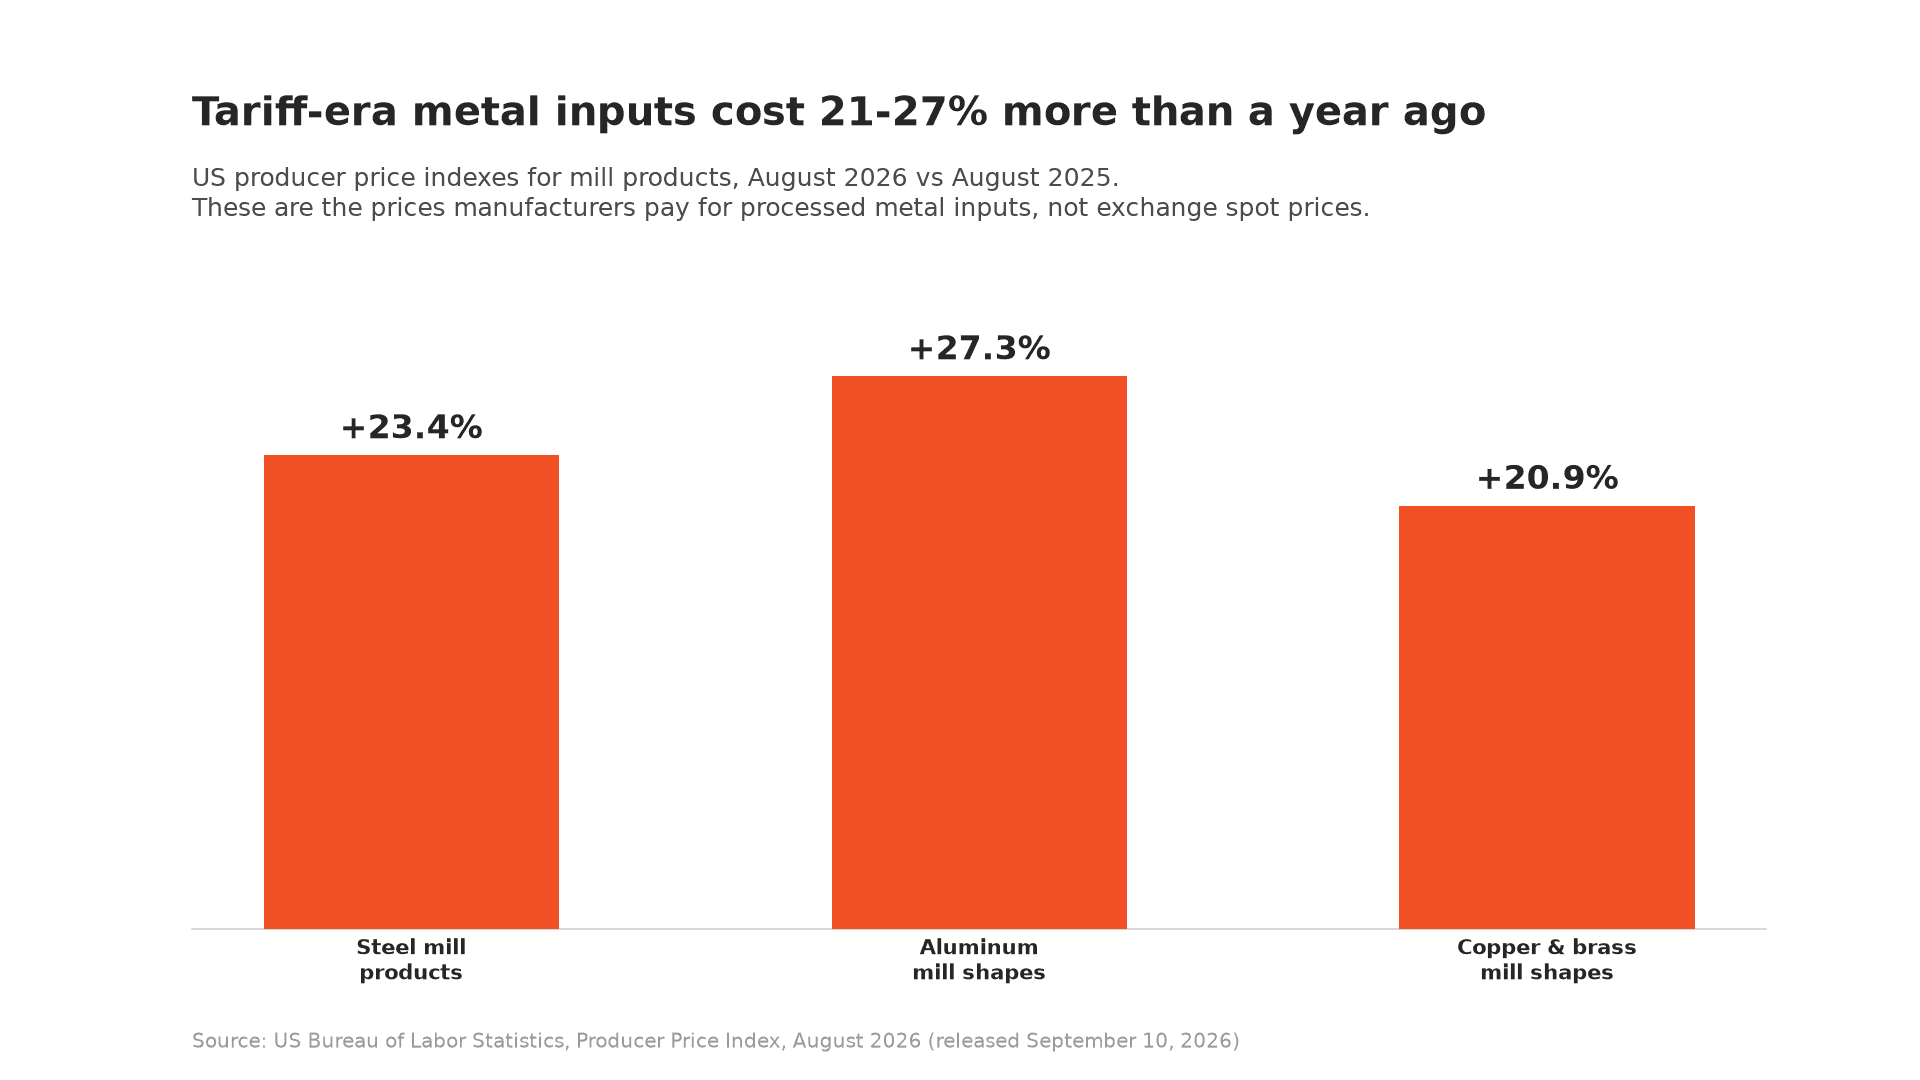
What manufacturers actually pay for processed metal inputs, August 2026 vs a year earlier -- Source: US Bureau of Labor Statistics, Producer Price Index (Sep 10, 2026)
Buffett's Textile Mills: A Warning for Factory Investors
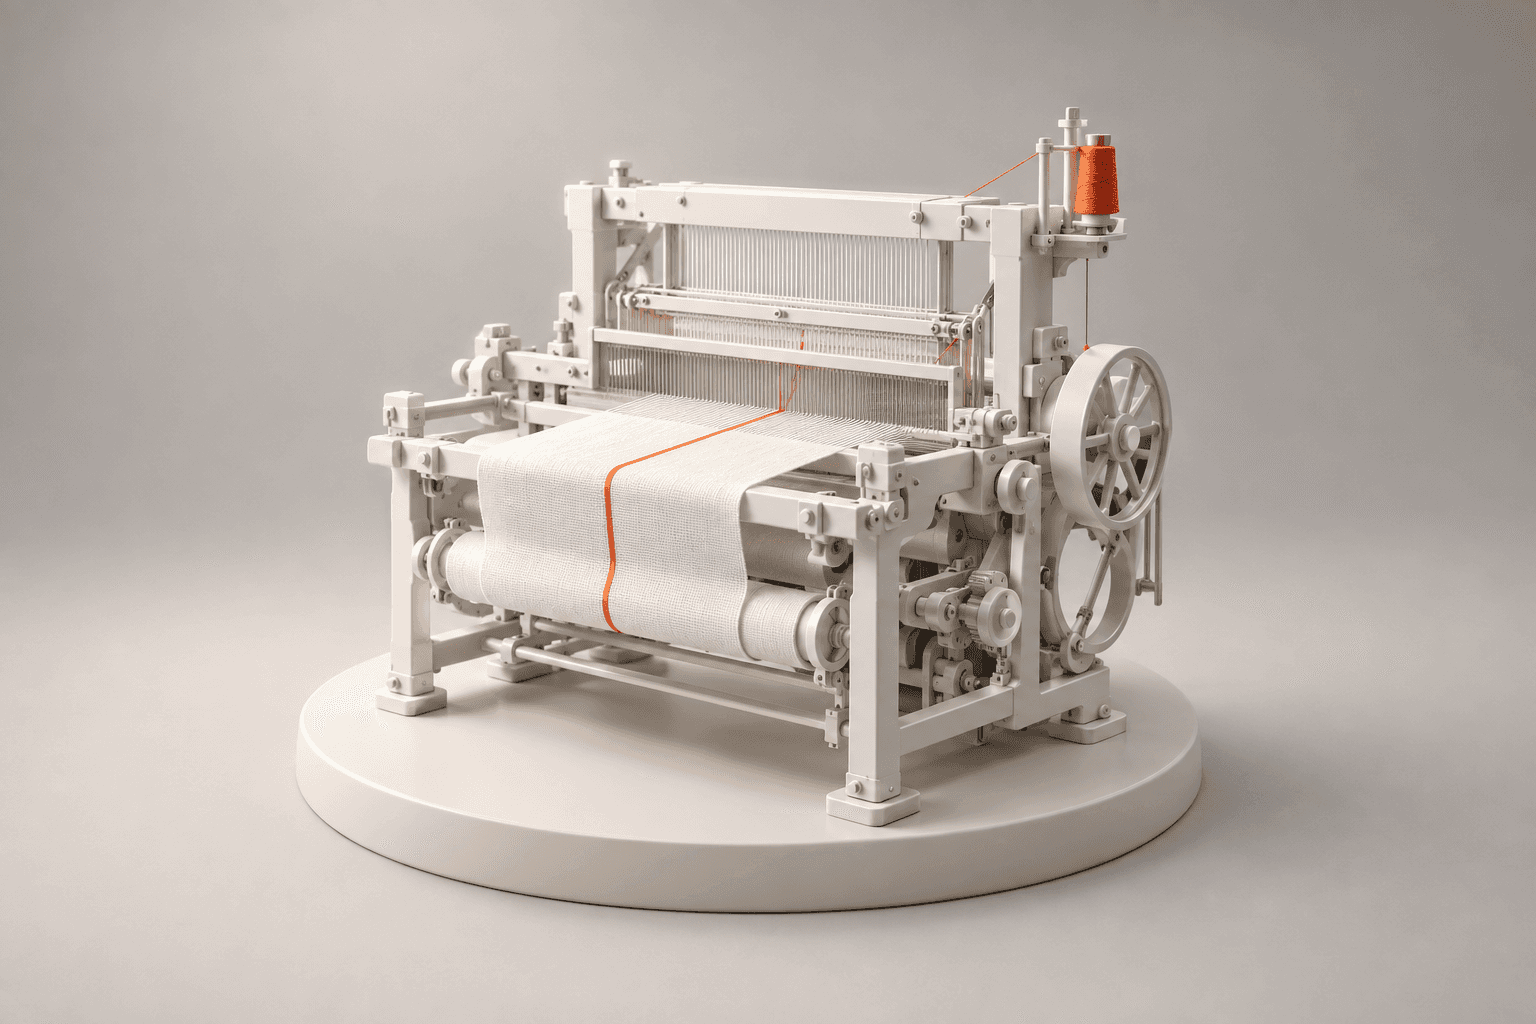
There is a historical warning worth sitting beside the optimism, and it comes from Warren Buffett's 1985 shareholder letter. Berkshire Hathaway's textile business kept approving equipment investments that looked attractive on standard return math: each new loom or spinning frame genuinely lowered costs. But every competitor could make the same investment, and as the industry's costs fell, selling prices fell with them. The savings flowed through to customers instead of owners, and Berkshire closed the textile operation that year, with more capital invested in the business than it had at the start.
The relevance to 2026 is the selling-price assumption buried in every new factory's investment case. A plant approved during a shortage tends to assume that shortage-era prices persist after it -- and every announced competitor -- reaches volume. Those two assumptions cannot both hold. Battery cells are the live example: the plants cancelled in 2025 were largely approved when cell capacity was scarce and prices reflected it. If your investment case needs 2022 pricing to clear its hurdle rate in 2027, the case is weaker than the spreadsheet says. The discipline I would want from any team right now is to model the selling price after the announced competing capacity ramps, discounted for the projects that will never finish, and see whether the returns survive.
One honest qualification: private returns are not the only reason to build. A domestic industrial base can be worth paying for -- defense readiness justifies capacity that looks underused on commercial math, a point I made at length in The Front Line Is a Factory Floor. But that capacity needs an explicit funding arrangement, with someone knowingly paying for availability. A subsidy that improves construction economics does not establish that subsequent production covers its continuing costs.
Five Tests for Whether the Supercycle Is Durable
"Supercycle" is a thesis about a sustained period of investment and production, not a statistical threshold you cross one month and celebrate. If you want to track whether Bessent's claim holds up, watch these five things over the next several quarters:
Test | Evidence it is working | Evidence it is failing |
|---|---|---|
Projects become operations | Plants commissioned, output ramps | Repeated delays and cancellations |
Demand sustains production | Repeat orders across end markets | Advance ordering, weak replenishment |
Economics support reinvestment | Returns hold as volumes grow | Costs outrun realizable prices |
Suppliers support growth | Qualified capacity expands with demand | Tooling, power, labor delays |
Gains persist | Multi-quarter gains in surveys and hard data | Strong months, no sustained output |
None of these is currently settled. LG Lansing passes the first test; the Rhodium cancellation data fails it for a chunk of the battery sector. Deere's backlog passes the second; its tariff bill puts the third in doubt. BCG's projected skilled-trades shortfall is a standing threat to the fourth. The scoreboard is genuinely mixed, which is what you would expect two years into a cycle this large.
Higher Rates Raise the Bar for Every New Project
The 10-year touching 5.045% got framed as the bond market voting against Bessent's optimism. The data supports a narrower reading. The San Francisco Fed's yield decomposition shows that between July 29 and September 15, its 10-year zero-coupon yield rose from 4.75% to 5.00% while the term premium stayed flat at 1.31% -- the entire move came from expected future short-term rates. That is the market repricing Fed policy in an economy running hotter than expected, not a verdict on manufacturing. The FOMC underlined the point a day later by hiking while describing growth as solid and capital investment as robust.
A narrower reading is still an expensive one if you are funding a ramp. Higher rates raise the required return on every new line and make every dollar of working capital more expensive to hold. The arithmetic is unforgiving: an extra $10 million of average inventory financed at 8% costs about $800,000 a year before storage, insurance, or obsolescence -- illustrative numbers, but the direction is the point. And on the demand side, real average hourly earnings fell 0.3% year over year in August, which means customers with shrinking purchasing power will resist the price increases manufacturers need to cover 20-27% metal inflation. Financing costs up, input costs up, pricing power limited: that is the squeeze the surveys are hinting at, even though no diffusion index can measure it.
Factory Profits Come Down to Part-by-Part Cost Decisions
I watched a version of this movie from inside Tesla during the Model 3 ramp. The factory existed, the demand existed -- around 450,000 reservations -- and none of that settled whether the car could be built at a cost that made the program work. That got settled in thousands of unglamorous decisions about cell costs, stamping yields, fastener counts, and which supplier got which part at which price. A supercycle, if this is one, will be won or lost the same way: inside bill of materials reviews, not congressional testimony.
For operators, that suggests a specific posture for the next few quarters:
Pull cost decisions forward. By the time a design is qualified and production is committed, most of the cost is locked. The cheapest time to fix a product's economics is while engineering still has should-cost models and sourcing options in front of it, before the tooling is cut.
Decompose every supplier increase. A quote that goes up 12% because "inflation" deserves the same scrutiny as any engineering claim. How much is metal, at which index? How much is energy, labor, yield, freight, tariff exposure? Deere can tell you its tariff bill to the nearest $50 million; your suppliers should be able to explain theirs.
Price the whole decision, not just the unit. At 4% policy rates, the working-capital consequences of a sourcing decision -- minimum order quantities, lead times, safety stock -- belong in the same spreadsheet as the piece price. A lower unit price that ties up an extra $10 million in inventory is often the more expensive option on a total cost of ownership basis.
Measure complete products, and mind your suppliers' cash. A buyer can hit a purchase-price-variance target by ordering 100,000 housings at a discount while the control-module supplier can only deliver 80,000 -- the extra 20,000 housings tie up cash without raising the shipment ceiling by a single unit. The same system-level logic applies to payment terms: stretching a constrained supplier by 30 days improves your cash position while starving the exact company whose next machine determines your ramp. For genuine bottlenecks, milestone-based tooling or capacity payments often beat hoarding cash locally and waiting longer for saleable output.
Qualify alternatives before you need them. A supplier in a database is not yet a second source. Samples, tooling, validation, and capacity commitments take quarters, and my colleague Andy Hunt has written about why dual sourcing alone doesn't create resilience. If the five tests above start failing, the companies with qualified alternatives will be the ones positioned to act. I made a related argument in the US-Canada tariff piece earlier this week; the metals PPI numbers are why it keeps coming up.
Plan against three scenarios, not one forecast. Demand holds and costs rise; demand weakens and costs stay high; constraints ease and prices normalize. Each implies different buys, buffers, and pricing. The management failure mode is betting the plan on a single macro call -- including Bessent's.
This is the work our customers at LightSource are doing right now: challenger manufacturers running aggressive NPI timelines who need engineering, procurement, and suppliers looking at the same part-level cost data early enough to act on it. The platform normalizes supplier bids on arrival and keeps BOM-level costs live as designs change, which matters most in exactly this environment -- when the difference between a durable program and a cancelled one is a few points of cost discipline.
Bessent may well be right about the decade. Whether he is right about the next two years depends less on how many factories get announced than on whether the products coming out of them can be made at costs their customers will accept -- and that gets decided in engineering reviews, supplier negotiations, and the working-capital lines of a thousand ramp budgets, none of which appear in testimony. Watch whether new orders, shipments, and actual production keep agreeing with each other over the next several months. That is the scoreboard worth trusting.
Sources
US Treasury -- Secretary Bessent's September 15 testimony -- the "industrial supercycle" statement to the House Financial Services Committee
New York Fed -- Empire State Manufacturing Survey, September 2026 -- all September survey values
Philadelphia Fed -- September 2026 Manufacturing Business Outlook Survey -- regional cross-check released September 17
ISM -- August 2026 Manufacturing PMI report -- eighth straight month of expansion; prices index at 71.1
Census Bureau -- Construction spending, July 2026 -- manufacturing construction put-in-place data (FRED series TLMFGCONS)
Federal Reserve -- G.17 Industrial Production, August 18, 2026 release -- July output, capacity utilization, business-equipment vs consumer-goods split
Federal Reserve -- FOMC statement, September 16, 2026 -- 25bp increase to 3.75-4.00%
San Francisco Fed -- Treasury Yield Premiums -- decomposition of the 10-year yield move
GAO -- CHIPS incentives implementation report, August 2026 -- $13.1B of $31.2B disbursed; milestone status
MIT-Rhodium Clean Investment Monitor -- Q4 2025 update -- $22B of EV-supply-chain manufacturing cancellations in 2025
BCG -- How US Manufacturers Can Win the Buildout Boom (September 2026) -- ~$6T investment projection; skilled-trades shortfall
Deloitte -- US defense manufacturing at industrial scale (May 2026) -- $557B combined prime backlog
Reuters via Investing.com -- Deere raises 2026 forecast (August 20, 2026) -- guidance, tariff costs, backlog commentary
Michigan EDC -- LG Energy Solution in Michigan (September 2026) -- Lansing plant takeover and $4.3B Tesla energy-storage agreement
BLS -- August 2026 Producer Price Index -- steel, aluminum, copper mill-product price changes
BLS -- August 2026 real earnings -- real average hourly earnings down 0.3% year over year
Berkshire Hathaway -- 1985 shareholder letter -- the textile business, competition, and returns on investment
Frequently Asked Questions
What is an industrial supercycle?
An industrial supercycle is a sustained, multiyear period in which investment in manufacturing capacity and the production that follows reinforce each other -- new factories, expanding output, and rising industrial employment persisting across business cycles rather than one strong year. It has no single statistical threshold, so it can only be confirmed over time: projects have to become operating plants, demand has to sustain production, and the economics have to justify reinvestment.
Is US manufacturing growing or shrinking in 2026?
National indicators point to growth with slowing momentum. The ISM Manufacturing PMI has shown expansion for eight consecutive months through August 2026, and manufacturing output was up 1.2% year over year through July. But manufacturing construction spending has fallen 32% from its September 2024 peak, regional surveys like Empire State show growth cooling, and capacity utilization remains about two points below its long-run average.
Why did manufacturing construction spending fall if there's a supercycle?
Falling construction spending is ambiguous on its own: it can mean projects finished and moved into production, or that projects were cancelled. Both are happening. Plants like LG Energy Solution's Lansing facility completed and opened in 2026, while the Clean Investment Monitor counted $22 billion of EV-supply-chain manufacturing cancellations in 2025 -- more than was newly announced that year.
Do higher bond yields contradict the industrial supercycle?
Higher yields raise the hurdle for new investment without delivering a verdict on manufacturing demand. The San Francisco Fed's decomposition of the recent move to 5% on the 10-year shows it came almost entirely from expected future policy rates rather than a rising term premium. For a manufacturer, the practical effect is higher required returns on new equipment and more expensive working capital, evaluated at the company's own borrowing terms.
How should procurement teams respond to rising input costs in 2026?
Decompose every supplier increase into its actual drivers -- metal indexes, energy, labor, freight, tariffs -- rather than accepting a blanket "inflation" adjustment, and compare each driver against the relevant benchmark for the specific part and origin. Pull cost decisions earlier into product development while designs can still change, price sourcing decisions on total cost of ownership including working capital, and qualify second sources before you need them.
Do tariffs help or hurt US manufacturers?
Both, depending on where a company sits in the value chain. Tariffs protect domestic primary producers -- US steel and aluminum mill-product prices are up 23-27% year over year -- but they raise input costs for every manufacturer downstream who buys those metals. Deere, for example, raised its 2026 earnings guidance while simultaneously projecting roughly $750 million in net tariff costs for the year.
On September 15, Treasury Secretary Scott Bessent told the House Financial Services Committee that "a new industrial supercycle is moving from investment into production, and from blueprints into paychecks." He had evidence behind him: the ISM survey has shown manufacturing growing for eight consecutive months, business activity is at a 52-month high, and the Atlanta Fed's tracker points to Q3 GDP growth above 4%. The same morning, the New York Fed's Empire State survey showed growth among New York manufacturers slowing sharply, with new orders barely positive, shipments slightly negative, and input prices rising at the fastest pace in years. By the close, the 10-year Treasury had touched 5.045% intraday, its highest level in 19 years. The next day, the Fed raised its policy rate a quarter point to 3.75-4.00%. The day after that, the Philadelphia Fed's September survey printed substantial activity and rising prices in the same release.
A reasonable person could read that week and conclude the supercycle is real. A reasonable person could read the same week and conclude manufacturers are heading into a tough couple of quarters. I think both readings are correct, and the interesting question sits underneath them: can the factories America has spent four years building produce competitively priced products at a profit? None of last week's releases can answer that, because the answer accumulates part by part, supplier by supplier, over the next several quarters. This post is about how I would keep score.
September Fed Surveys Show Growth Slowing and Prices Rising
The Empire State survey deserves a careful read before anyone builds a macro narrative on it. Here is what actually moved between August and September:
What moved in the September Empire State survey: activity indexes fell, both price indexes rose, hours held up -- Source: Federal Reserve Bank of New York (Sep 15, 2026)
These are diffusion indexes: they measure how many of roughly 100 surveyed New York manufacturers reported increases versus decreases, not how much anything changed. A reading of 7.6 means growth continued at a slower breadth, not that output fell 7.6%. And subtracting the prices-received index from the prices-paid index does not calculate anyone's margin -- diffusion indexes have no magnitudes, so establishing an actual margin effect requires financial data, not survey breadth. What the survey does say clearly: activity in one region cooled, hiring and hours held up, and far more firms are seeing input costs rise than fall.
The national picture is stronger than New York's. The August ISM Manufacturing PMI came in at 54.6, the eighth straight month above the 50 expansion threshold, with fifteen industries reporting growth -- though its prices index sat at 71.1, and the ISM composite gets a mechanical lift from slow supplier deliveries, which is friction rather than health. Philadelphia's September survey, released September 17, showed general activity at 37.8 with prices paid at 48.6. The honest summary across all three: the expansion is intact, its momentum is cooling, and cost pressure is broadening. That is a real mixed picture, not a contradiction to be argued away.
Factory Construction Peaked in 2024, but Production Keeps Rising
The investment side of the supercycle has already rolled over, and it is worth being precise about what that does and does not mean. Census data on manufacturing construction spending tells the whole arc: $97.9 billion (annualized) in January 2022, a peak of $250.2 billion in September 2024, and $169.8 billion as of July 2026. That is 32% below the peak and still 73% above where the boom started. Actual dollars spent from January through July 2026 ran 22% below the same period last year. Anyone quoting only one of those comparisons is selling you a narrative.
Falling construction spending is genuinely ambiguous. It can mean projects finished and moved into production, which supports Bessent's "investment into production" framing. LG Energy Solution's Lansing plant is the clean example: LG took full control of the former Ultium facility in May 2025, held its grand opening on August 18, 2026, and has a $4.3 billion agreement to supply Tesla with energy-storage cells built there -- an EV-era asset redirected toward storage demand. Or falling construction can mean projects died. The MIT-Rhodium Clean Investment Monitor counted $22 billion of EV-supply-chain manufacturing investment cancelled in 2025, more than the $21 billion in new announcements, and Intel has pushed its $28 billion Ohio campus out to 2030-31.
The production data leans toward Bessent, with caveats. Manufacturing output rose 1.2% year over year through July, and the composition matters: business-equipment output was up 6.6% while consumer-goods output was down 1.8%. The demand pulling factories forward right now is capex demand -- data centers, grid equipment, defense -- rather than household spending. Meanwhile, manufacturing capacity utilization sits at 76.0%, about two points below its long-run average, and the aggregate hides a wide spread: chemicals ran at 71.6% in July while nonmetallic mineral products ran at 82.6%. Spare capacity in one industry cannot produce the casting or certified component another industry needs, so "76% utilized" says very little about whether the specific qualified supplier you depend on has room for your volume. The GAO's August checkpoint on CHIPS Act implementation found $13.1 billion of $31.2 billion in direct funding actually disbursed -- real progress, and also a reminder that disbursement is not the same thing as commercial production.
Cancelled Plants vs. Record Order Books
The strongest bear case is concrete. Battery manufacturing alone saw $11 billion of cancelled investment in 2025, ten times the 2024 level, against just $8 billion in new announcements. T1 Energy scrapped its $2.5 billion Georgia cell plant; AESC paused a $1.6 billion South Carolina facility. Tariffs cut both ways in this story: they protect some domestic producers while raising input costs for everyone downstream. August producer prices for steel mill products were up 23.4% year over year, aluminum mill shapes up 27.3%, and copper and brass mill shapes up 20.9%. BCG's Daniel Kupper put the downstream problem bluntly: "Even the most efficient factories can't overcompensate for the impact from tariffs."
The strongest bull case is equally concrete. Deloitte puts the combined backlog of the three largest US defense primes at $557 billion, roughly 2.7 times their 2025 sales. The commercial aircraft backlog is around 14,000 planes -- close to a decade of production. BCG's September analysis projects nearly $6 trillion of US domestic investment between 2025 and 2029, with about 85% of it in data centers, AI compute, and electrification. Those are multiyear demand commitments, not sentiment readings -- although the same BCG team projects a shortfall of roughly 2 million skilled-trade workers by 2030 and adds the right qualifier: "But capital is the easy part."
Deere's August earnings show what it looks like when both cases apply to one company. The company raised its full-year net income guidance to $4.75-5.0 billion on an 18% jump in construction-and-forestry sales, and its investor relations team noted that "customer backlogs now extend well into fiscal year 2027." The same call projected roughly $750 million in net tariff costs for 2026 and $1 billion for 2027. The demand side of Deere's business is in excellent shape; whether the cost side lets it keep the margin on that demand is the open question. That is the entire supercycle debate compressed into a single income statement.
What manufacturers actually pay for processed metal inputs, August 2026 vs a year earlier -- Source: US Bureau of Labor Statistics, Producer Price Index (Sep 10, 2026)
Buffett's Textile Mills: A Warning for Factory Investors
There is a historical warning worth sitting beside the optimism, and it comes from Warren Buffett's 1985 shareholder letter. Berkshire Hathaway's textile business kept approving equipment investments that looked attractive on standard return math: each new loom or spinning frame genuinely lowered costs. But every competitor could make the same investment, and as the industry's costs fell, selling prices fell with them. The savings flowed through to customers instead of owners, and Berkshire closed the textile operation that year, with more capital invested in the business than it had at the start.
The relevance to 2026 is the selling-price assumption buried in every new factory's investment case. A plant approved during a shortage tends to assume that shortage-era prices persist after it -- and every announced competitor -- reaches volume. Those two assumptions cannot both hold. Battery cells are the live example: the plants cancelled in 2025 were largely approved when cell capacity was scarce and prices reflected it. If your investment case needs 2022 pricing to clear its hurdle rate in 2027, the case is weaker than the spreadsheet says. The discipline I would want from any team right now is to model the selling price after the announced competing capacity ramps, discounted for the projects that will never finish, and see whether the returns survive.
One honest qualification: private returns are not the only reason to build. A domestic industrial base can be worth paying for -- defense readiness justifies capacity that looks underused on commercial math, a point I made at length in The Front Line Is a Factory Floor. But that capacity needs an explicit funding arrangement, with someone knowingly paying for availability. A subsidy that improves construction economics does not establish that subsequent production covers its continuing costs.
Five Tests for Whether the Supercycle Is Durable
"Supercycle" is a thesis about a sustained period of investment and production, not a statistical threshold you cross one month and celebrate. If you want to track whether Bessent's claim holds up, watch these five things over the next several quarters:
Test | Evidence it is working | Evidence it is failing |
|---|---|---|
Projects become operations | Plants commissioned, output ramps | Repeated delays and cancellations |
Demand sustains production | Repeat orders across end markets | Advance ordering, weak replenishment |
Economics support reinvestment | Returns hold as volumes grow | Costs outrun realizable prices |
Suppliers support growth | Qualified capacity expands with demand | Tooling, power, labor delays |
Gains persist | Multi-quarter gains in surveys and hard data | Strong months, no sustained output |
None of these is currently settled. LG Lansing passes the first test; the Rhodium cancellation data fails it for a chunk of the battery sector. Deere's backlog passes the second; its tariff bill puts the third in doubt. BCG's projected skilled-trades shortfall is a standing threat to the fourth. The scoreboard is genuinely mixed, which is what you would expect two years into a cycle this large.
Higher Rates Raise the Bar for Every New Project
The 10-year touching 5.045% got framed as the bond market voting against Bessent's optimism. The data supports a narrower reading. The San Francisco Fed's yield decomposition shows that between July 29 and September 15, its 10-year zero-coupon yield rose from 4.75% to 5.00% while the term premium stayed flat at 1.31% -- the entire move came from expected future short-term rates. That is the market repricing Fed policy in an economy running hotter than expected, not a verdict on manufacturing. The FOMC underlined the point a day later by hiking while describing growth as solid and capital investment as robust.
A narrower reading is still an expensive one if you are funding a ramp. Higher rates raise the required return on every new line and make every dollar of working capital more expensive to hold. The arithmetic is unforgiving: an extra $10 million of average inventory financed at 8% costs about $800,000 a year before storage, insurance, or obsolescence -- illustrative numbers, but the direction is the point. And on the demand side, real average hourly earnings fell 0.3% year over year in August, which means customers with shrinking purchasing power will resist the price increases manufacturers need to cover 20-27% metal inflation. Financing costs up, input costs up, pricing power limited: that is the squeeze the surveys are hinting at, even though no diffusion index can measure it.
Factory Profits Come Down to Part-by-Part Cost Decisions
I watched a version of this movie from inside Tesla during the Model 3 ramp. The factory existed, the demand existed -- around 450,000 reservations -- and none of that settled whether the car could be built at a cost that made the program work. That got settled in thousands of unglamorous decisions about cell costs, stamping yields, fastener counts, and which supplier got which part at which price. A supercycle, if this is one, will be won or lost the same way: inside bill of materials reviews, not congressional testimony.
For operators, that suggests a specific posture for the next few quarters:
Pull cost decisions forward. By the time a design is qualified and production is committed, most of the cost is locked. The cheapest time to fix a product's economics is while engineering still has should-cost models and sourcing options in front of it, before the tooling is cut.
Decompose every supplier increase. A quote that goes up 12% because "inflation" deserves the same scrutiny as any engineering claim. How much is metal, at which index? How much is energy, labor, yield, freight, tariff exposure? Deere can tell you its tariff bill to the nearest $50 million; your suppliers should be able to explain theirs.
Price the whole decision, not just the unit. At 4% policy rates, the working-capital consequences of a sourcing decision -- minimum order quantities, lead times, safety stock -- belong in the same spreadsheet as the piece price. A lower unit price that ties up an extra $10 million in inventory is often the more expensive option on a total cost of ownership basis.
Measure complete products, and mind your suppliers' cash. A buyer can hit a purchase-price-variance target by ordering 100,000 housings at a discount while the control-module supplier can only deliver 80,000 -- the extra 20,000 housings tie up cash without raising the shipment ceiling by a single unit. The same system-level logic applies to payment terms: stretching a constrained supplier by 30 days improves your cash position while starving the exact company whose next machine determines your ramp. For genuine bottlenecks, milestone-based tooling or capacity payments often beat hoarding cash locally and waiting longer for saleable output.
Qualify alternatives before you need them. A supplier in a database is not yet a second source. Samples, tooling, validation, and capacity commitments take quarters, and my colleague Andy Hunt has written about why dual sourcing alone doesn't create resilience. If the five tests above start failing, the companies with qualified alternatives will be the ones positioned to act. I made a related argument in the US-Canada tariff piece earlier this week; the metals PPI numbers are why it keeps coming up.
Plan against three scenarios, not one forecast. Demand holds and costs rise; demand weakens and costs stay high; constraints ease and prices normalize. Each implies different buys, buffers, and pricing. The management failure mode is betting the plan on a single macro call -- including Bessent's.
This is the work our customers at LightSource are doing right now: challenger manufacturers running aggressive NPI timelines who need engineering, procurement, and suppliers looking at the same part-level cost data early enough to act on it. The platform normalizes supplier bids on arrival and keeps BOM-level costs live as designs change, which matters most in exactly this environment -- when the difference between a durable program and a cancelled one is a few points of cost discipline.
Bessent may well be right about the decade. Whether he is right about the next two years depends less on how many factories get announced than on whether the products coming out of them can be made at costs their customers will accept -- and that gets decided in engineering reviews, supplier negotiations, and the working-capital lines of a thousand ramp budgets, none of which appear in testimony. Watch whether new orders, shipments, and actual production keep agreeing with each other over the next several months. That is the scoreboard worth trusting.
Sources
US Treasury -- Secretary Bessent's September 15 testimony -- the "industrial supercycle" statement to the House Financial Services Committee
New York Fed -- Empire State Manufacturing Survey, September 2026 -- all September survey values
Philadelphia Fed -- September 2026 Manufacturing Business Outlook Survey -- regional cross-check released September 17
ISM -- August 2026 Manufacturing PMI report -- eighth straight month of expansion; prices index at 71.1
Census Bureau -- Construction spending, July 2026 -- manufacturing construction put-in-place data (FRED series TLMFGCONS)
Federal Reserve -- G.17 Industrial Production, August 18, 2026 release -- July output, capacity utilization, business-equipment vs consumer-goods split
Federal Reserve -- FOMC statement, September 16, 2026 -- 25bp increase to 3.75-4.00%
San Francisco Fed -- Treasury Yield Premiums -- decomposition of the 10-year yield move
GAO -- CHIPS incentives implementation report, August 2026 -- $13.1B of $31.2B disbursed; milestone status
MIT-Rhodium Clean Investment Monitor -- Q4 2025 update -- $22B of EV-supply-chain manufacturing cancellations in 2025
BCG -- How US Manufacturers Can Win the Buildout Boom (September 2026) -- ~$6T investment projection; skilled-trades shortfall
Deloitte -- US defense manufacturing at industrial scale (May 2026) -- $557B combined prime backlog
Reuters via Investing.com -- Deere raises 2026 forecast (August 20, 2026) -- guidance, tariff costs, backlog commentary
Michigan EDC -- LG Energy Solution in Michigan (September 2026) -- Lansing plant takeover and $4.3B Tesla energy-storage agreement
BLS -- August 2026 Producer Price Index -- steel, aluminum, copper mill-product price changes
BLS -- August 2026 real earnings -- real average hourly earnings down 0.3% year over year
Berkshire Hathaway -- 1985 shareholder letter -- the textile business, competition, and returns on investment
Frequently Asked Questions
What is an industrial supercycle?
An industrial supercycle is a sustained, multiyear period in which investment in manufacturing capacity and the production that follows reinforce each other -- new factories, expanding output, and rising industrial employment persisting across business cycles rather than one strong year. It has no single statistical threshold, so it can only be confirmed over time: projects have to become operating plants, demand has to sustain production, and the economics have to justify reinvestment.
Is US manufacturing growing or shrinking in 2026?
National indicators point to growth with slowing momentum. The ISM Manufacturing PMI has shown expansion for eight consecutive months through August 2026, and manufacturing output was up 1.2% year over year through July. But manufacturing construction spending has fallen 32% from its September 2024 peak, regional surveys like Empire State show growth cooling, and capacity utilization remains about two points below its long-run average.
Why did manufacturing construction spending fall if there's a supercycle?
Falling construction spending is ambiguous on its own: it can mean projects finished and moved into production, or that projects were cancelled. Both are happening. Plants like LG Energy Solution's Lansing facility completed and opened in 2026, while the Clean Investment Monitor counted $22 billion of EV-supply-chain manufacturing cancellations in 2025 -- more than was newly announced that year.
Do higher bond yields contradict the industrial supercycle?
Higher yields raise the hurdle for new investment without delivering a verdict on manufacturing demand. The San Francisco Fed's decomposition of the recent move to 5% on the 10-year shows it came almost entirely from expected future policy rates rather than a rising term premium. For a manufacturer, the practical effect is higher required returns on new equipment and more expensive working capital, evaluated at the company's own borrowing terms.
How should procurement teams respond to rising input costs in 2026?
Decompose every supplier increase into its actual drivers -- metal indexes, energy, labor, freight, tariffs -- rather than accepting a blanket "inflation" adjustment, and compare each driver against the relevant benchmark for the specific part and origin. Pull cost decisions earlier into product development while designs can still change, price sourcing decisions on total cost of ownership including working capital, and qualify second sources before you need them.
Do tariffs help or hurt US manufacturers?
Both, depending on where a company sits in the value chain. Tariffs protect domestic primary producers -- US steel and aluminum mill-product prices are up 23-27% year over year -- but they raise input costs for every manufacturer downstream who buys those metals. Deere, for example, raised its 2026 earnings guidance while simultaneously projecting roughly $750 million in net tariff costs for the year.
On September 15, Treasury Secretary Scott Bessent told the House Financial Services Committee that "a new industrial supercycle is moving from investment into production, and from blueprints into paychecks." He had evidence behind him: the ISM survey has shown manufacturing growing for eight consecutive months, business activity is at a 52-month high, and the Atlanta Fed's tracker points to Q3 GDP growth above 4%. The same morning, the New York Fed's Empire State survey showed growth among New York manufacturers slowing sharply, with new orders barely positive, shipments slightly negative, and input prices rising at the fastest pace in years. By the close, the 10-year Treasury had touched 5.045% intraday, its highest level in 19 years. The next day, the Fed raised its policy rate a quarter point to 3.75-4.00%. The day after that, the Philadelphia Fed's September survey printed substantial activity and rising prices in the same release.
A reasonable person could read that week and conclude the supercycle is real. A reasonable person could read the same week and conclude manufacturers are heading into a tough couple of quarters. I think both readings are correct, and the interesting question sits underneath them: can the factories America has spent four years building produce competitively priced products at a profit? None of last week's releases can answer that, because the answer accumulates part by part, supplier by supplier, over the next several quarters. This post is about how I would keep score.
September Fed Surveys Show Growth Slowing and Prices Rising
The Empire State survey deserves a careful read before anyone builds a macro narrative on it. Here is what actually moved between August and September:
What moved in the September Empire State survey: activity indexes fell, both price indexes rose, hours held up -- Source: Federal Reserve Bank of New York (Sep 15, 2026)
These are diffusion indexes: they measure how many of roughly 100 surveyed New York manufacturers reported increases versus decreases, not how much anything changed. A reading of 7.6 means growth continued at a slower breadth, not that output fell 7.6%. And subtracting the prices-received index from the prices-paid index does not calculate anyone's margin -- diffusion indexes have no magnitudes, so establishing an actual margin effect requires financial data, not survey breadth. What the survey does say clearly: activity in one region cooled, hiring and hours held up, and far more firms are seeing input costs rise than fall.
The national picture is stronger than New York's. The August ISM Manufacturing PMI came in at 54.6, the eighth straight month above the 50 expansion threshold, with fifteen industries reporting growth -- though its prices index sat at 71.1, and the ISM composite gets a mechanical lift from slow supplier deliveries, which is friction rather than health. Philadelphia's September survey, released September 17, showed general activity at 37.8 with prices paid at 48.6. The honest summary across all three: the expansion is intact, its momentum is cooling, and cost pressure is broadening. That is a real mixed picture, not a contradiction to be argued away.
Factory Construction Peaked in 2024, but Production Keeps Rising
The investment side of the supercycle has already rolled over, and it is worth being precise about what that does and does not mean. Census data on manufacturing construction spending tells the whole arc: $97.9 billion (annualized) in January 2022, a peak of $250.2 billion in September 2024, and $169.8 billion as of July 2026. That is 32% below the peak and still 73% above where the boom started. Actual dollars spent from January through July 2026 ran 22% below the same period last year. Anyone quoting only one of those comparisons is selling you a narrative.
Falling construction spending is genuinely ambiguous. It can mean projects finished and moved into production, which supports Bessent's "investment into production" framing. LG Energy Solution's Lansing plant is the clean example: LG took full control of the former Ultium facility in May 2025, held its grand opening on August 18, 2026, and has a $4.3 billion agreement to supply Tesla with energy-storage cells built there -- an EV-era asset redirected toward storage demand. Or falling construction can mean projects died. The MIT-Rhodium Clean Investment Monitor counted $22 billion of EV-supply-chain manufacturing investment cancelled in 2025, more than the $21 billion in new announcements, and Intel has pushed its $28 billion Ohio campus out to 2030-31.
The production data leans toward Bessent, with caveats. Manufacturing output rose 1.2% year over year through July, and the composition matters: business-equipment output was up 6.6% while consumer-goods output was down 1.8%. The demand pulling factories forward right now is capex demand -- data centers, grid equipment, defense -- rather than household spending. Meanwhile, manufacturing capacity utilization sits at 76.0%, about two points below its long-run average, and the aggregate hides a wide spread: chemicals ran at 71.6% in July while nonmetallic mineral products ran at 82.6%. Spare capacity in one industry cannot produce the casting or certified component another industry needs, so "76% utilized" says very little about whether the specific qualified supplier you depend on has room for your volume. The GAO's August checkpoint on CHIPS Act implementation found $13.1 billion of $31.2 billion in direct funding actually disbursed -- real progress, and also a reminder that disbursement is not the same thing as commercial production.
Cancelled Plants vs. Record Order Books
The strongest bear case is concrete. Battery manufacturing alone saw $11 billion of cancelled investment in 2025, ten times the 2024 level, against just $8 billion in new announcements. T1 Energy scrapped its $2.5 billion Georgia cell plant; AESC paused a $1.6 billion South Carolina facility. Tariffs cut both ways in this story: they protect some domestic producers while raising input costs for everyone downstream. August producer prices for steel mill products were up 23.4% year over year, aluminum mill shapes up 27.3%, and copper and brass mill shapes up 20.9%. BCG's Daniel Kupper put the downstream problem bluntly: "Even the most efficient factories can't overcompensate for the impact from tariffs."
The strongest bull case is equally concrete. Deloitte puts the combined backlog of the three largest US defense primes at $557 billion, roughly 2.7 times their 2025 sales. The commercial aircraft backlog is around 14,000 planes -- close to a decade of production. BCG's September analysis projects nearly $6 trillion of US domestic investment between 2025 and 2029, with about 85% of it in data centers, AI compute, and electrification. Those are multiyear demand commitments, not sentiment readings -- although the same BCG team projects a shortfall of roughly 2 million skilled-trade workers by 2030 and adds the right qualifier: "But capital is the easy part."
Deere's August earnings show what it looks like when both cases apply to one company. The company raised its full-year net income guidance to $4.75-5.0 billion on an 18% jump in construction-and-forestry sales, and its investor relations team noted that "customer backlogs now extend well into fiscal year 2027." The same call projected roughly $750 million in net tariff costs for 2026 and $1 billion for 2027. The demand side of Deere's business is in excellent shape; whether the cost side lets it keep the margin on that demand is the open question. That is the entire supercycle debate compressed into a single income statement.
What manufacturers actually pay for processed metal inputs, August 2026 vs a year earlier -- Source: US Bureau of Labor Statistics, Producer Price Index (Sep 10, 2026)
Buffett's Textile Mills: A Warning for Factory Investors
There is a historical warning worth sitting beside the optimism, and it comes from Warren Buffett's 1985 shareholder letter. Berkshire Hathaway's textile business kept approving equipment investments that looked attractive on standard return math: each new loom or spinning frame genuinely lowered costs. But every competitor could make the same investment, and as the industry's costs fell, selling prices fell with them. The savings flowed through to customers instead of owners, and Berkshire closed the textile operation that year, with more capital invested in the business than it had at the start.
The relevance to 2026 is the selling-price assumption buried in every new factory's investment case. A plant approved during a shortage tends to assume that shortage-era prices persist after it -- and every announced competitor -- reaches volume. Those two assumptions cannot both hold. Battery cells are the live example: the plants cancelled in 2025 were largely approved when cell capacity was scarce and prices reflected it. If your investment case needs 2022 pricing to clear its hurdle rate in 2027, the case is weaker than the spreadsheet says. The discipline I would want from any team right now is to model the selling price after the announced competing capacity ramps, discounted for the projects that will never finish, and see whether the returns survive.
One honest qualification: private returns are not the only reason to build. A domestic industrial base can be worth paying for -- defense readiness justifies capacity that looks underused on commercial math, a point I made at length in The Front Line Is a Factory Floor. But that capacity needs an explicit funding arrangement, with someone knowingly paying for availability. A subsidy that improves construction economics does not establish that subsequent production covers its continuing costs.
Five Tests for Whether the Supercycle Is Durable
"Supercycle" is a thesis about a sustained period of investment and production, not a statistical threshold you cross one month and celebrate. If you want to track whether Bessent's claim holds up, watch these five things over the next several quarters:
Test | Evidence it is working | Evidence it is failing |
|---|---|---|
Projects become operations | Plants commissioned, output ramps | Repeated delays and cancellations |
Demand sustains production | Repeat orders across end markets | Advance ordering, weak replenishment |
Economics support reinvestment | Returns hold as volumes grow | Costs outrun realizable prices |
Suppliers support growth | Qualified capacity expands with demand | Tooling, power, labor delays |
Gains persist | Multi-quarter gains in surveys and hard data | Strong months, no sustained output |
None of these is currently settled. LG Lansing passes the first test; the Rhodium cancellation data fails it for a chunk of the battery sector. Deere's backlog passes the second; its tariff bill puts the third in doubt. BCG's projected skilled-trades shortfall is a standing threat to the fourth. The scoreboard is genuinely mixed, which is what you would expect two years into a cycle this large.
Higher Rates Raise the Bar for Every New Project
The 10-year touching 5.045% got framed as the bond market voting against Bessent's optimism. The data supports a narrower reading. The San Francisco Fed's yield decomposition shows that between July 29 and September 15, its 10-year zero-coupon yield rose from 4.75% to 5.00% while the term premium stayed flat at 1.31% -- the entire move came from expected future short-term rates. That is the market repricing Fed policy in an economy running hotter than expected, not a verdict on manufacturing. The FOMC underlined the point a day later by hiking while describing growth as solid and capital investment as robust.
A narrower reading is still an expensive one if you are funding a ramp. Higher rates raise the required return on every new line and make every dollar of working capital more expensive to hold. The arithmetic is unforgiving: an extra $10 million of average inventory financed at 8% costs about $800,000 a year before storage, insurance, or obsolescence -- illustrative numbers, but the direction is the point. And on the demand side, real average hourly earnings fell 0.3% year over year in August, which means customers with shrinking purchasing power will resist the price increases manufacturers need to cover 20-27% metal inflation. Financing costs up, input costs up, pricing power limited: that is the squeeze the surveys are hinting at, even though no diffusion index can measure it.
Factory Profits Come Down to Part-by-Part Cost Decisions
I watched a version of this movie from inside Tesla during the Model 3 ramp. The factory existed, the demand existed -- around 450,000 reservations -- and none of that settled whether the car could be built at a cost that made the program work. That got settled in thousands of unglamorous decisions about cell costs, stamping yields, fastener counts, and which supplier got which part at which price. A supercycle, if this is one, will be won or lost the same way: inside bill of materials reviews, not congressional testimony.
For operators, that suggests a specific posture for the next few quarters:
Pull cost decisions forward. By the time a design is qualified and production is committed, most of the cost is locked. The cheapest time to fix a product's economics is while engineering still has should-cost models and sourcing options in front of it, before the tooling is cut.
Decompose every supplier increase. A quote that goes up 12% because "inflation" deserves the same scrutiny as any engineering claim. How much is metal, at which index? How much is energy, labor, yield, freight, tariff exposure? Deere can tell you its tariff bill to the nearest $50 million; your suppliers should be able to explain theirs.
Price the whole decision, not just the unit. At 4% policy rates, the working-capital consequences of a sourcing decision -- minimum order quantities, lead times, safety stock -- belong in the same spreadsheet as the piece price. A lower unit price that ties up an extra $10 million in inventory is often the more expensive option on a total cost of ownership basis.
Measure complete products, and mind your suppliers' cash. A buyer can hit a purchase-price-variance target by ordering 100,000 housings at a discount while the control-module supplier can only deliver 80,000 -- the extra 20,000 housings tie up cash without raising the shipment ceiling by a single unit. The same system-level logic applies to payment terms: stretching a constrained supplier by 30 days improves your cash position while starving the exact company whose next machine determines your ramp. For genuine bottlenecks, milestone-based tooling or capacity payments often beat hoarding cash locally and waiting longer for saleable output.
Qualify alternatives before you need them. A supplier in a database is not yet a second source. Samples, tooling, validation, and capacity commitments take quarters, and my colleague Andy Hunt has written about why dual sourcing alone doesn't create resilience. If the five tests above start failing, the companies with qualified alternatives will be the ones positioned to act. I made a related argument in the US-Canada tariff piece earlier this week; the metals PPI numbers are why it keeps coming up.
Plan against three scenarios, not one forecast. Demand holds and costs rise; demand weakens and costs stay high; constraints ease and prices normalize. Each implies different buys, buffers, and pricing. The management failure mode is betting the plan on a single macro call -- including Bessent's.
This is the work our customers at LightSource are doing right now: challenger manufacturers running aggressive NPI timelines who need engineering, procurement, and suppliers looking at the same part-level cost data early enough to act on it. The platform normalizes supplier bids on arrival and keeps BOM-level costs live as designs change, which matters most in exactly this environment -- when the difference between a durable program and a cancelled one is a few points of cost discipline.
Bessent may well be right about the decade. Whether he is right about the next two years depends less on how many factories get announced than on whether the products coming out of them can be made at costs their customers will accept -- and that gets decided in engineering reviews, supplier negotiations, and the working-capital lines of a thousand ramp budgets, none of which appear in testimony. Watch whether new orders, shipments, and actual production keep agreeing with each other over the next several months. That is the scoreboard worth trusting.
Sources
US Treasury -- Secretary Bessent's September 15 testimony -- the "industrial supercycle" statement to the House Financial Services Committee
New York Fed -- Empire State Manufacturing Survey, September 2026 -- all September survey values
Philadelphia Fed -- September 2026 Manufacturing Business Outlook Survey -- regional cross-check released September 17
ISM -- August 2026 Manufacturing PMI report -- eighth straight month of expansion; prices index at 71.1
Census Bureau -- Construction spending, July 2026 -- manufacturing construction put-in-place data (FRED series TLMFGCONS)
Federal Reserve -- G.17 Industrial Production, August 18, 2026 release -- July output, capacity utilization, business-equipment vs consumer-goods split
Federal Reserve -- FOMC statement, September 16, 2026 -- 25bp increase to 3.75-4.00%
San Francisco Fed -- Treasury Yield Premiums -- decomposition of the 10-year yield move
GAO -- CHIPS incentives implementation report, August 2026 -- $13.1B of $31.2B disbursed; milestone status
MIT-Rhodium Clean Investment Monitor -- Q4 2025 update -- $22B of EV-supply-chain manufacturing cancellations in 2025
BCG -- How US Manufacturers Can Win the Buildout Boom (September 2026) -- ~$6T investment projection; skilled-trades shortfall
Deloitte -- US defense manufacturing at industrial scale (May 2026) -- $557B combined prime backlog
Reuters via Investing.com -- Deere raises 2026 forecast (August 20, 2026) -- guidance, tariff costs, backlog commentary
Michigan EDC -- LG Energy Solution in Michigan (September 2026) -- Lansing plant takeover and $4.3B Tesla energy-storage agreement
BLS -- August 2026 Producer Price Index -- steel, aluminum, copper mill-product price changes
BLS -- August 2026 real earnings -- real average hourly earnings down 0.3% year over year
Berkshire Hathaway -- 1985 shareholder letter -- the textile business, competition, and returns on investment
Frequently Asked Questions
What is an industrial supercycle?
An industrial supercycle is a sustained, multiyear period in which investment in manufacturing capacity and the production that follows reinforce each other -- new factories, expanding output, and rising industrial employment persisting across business cycles rather than one strong year. It has no single statistical threshold, so it can only be confirmed over time: projects have to become operating plants, demand has to sustain production, and the economics have to justify reinvestment.
Is US manufacturing growing or shrinking in 2026?
National indicators point to growth with slowing momentum. The ISM Manufacturing PMI has shown expansion for eight consecutive months through August 2026, and manufacturing output was up 1.2% year over year through July. But manufacturing construction spending has fallen 32% from its September 2024 peak, regional surveys like Empire State show growth cooling, and capacity utilization remains about two points below its long-run average.
Why did manufacturing construction spending fall if there's a supercycle?
Falling construction spending is ambiguous on its own: it can mean projects finished and moved into production, or that projects were cancelled. Both are happening. Plants like LG Energy Solution's Lansing facility completed and opened in 2026, while the Clean Investment Monitor counted $22 billion of EV-supply-chain manufacturing cancellations in 2025 -- more than was newly announced that year.
Do higher bond yields contradict the industrial supercycle?
Higher yields raise the hurdle for new investment without delivering a verdict on manufacturing demand. The San Francisco Fed's decomposition of the recent move to 5% on the 10-year shows it came almost entirely from expected future policy rates rather than a rising term premium. For a manufacturer, the practical effect is higher required returns on new equipment and more expensive working capital, evaluated at the company's own borrowing terms.
How should procurement teams respond to rising input costs in 2026?
Decompose every supplier increase into its actual drivers -- metal indexes, energy, labor, freight, tariffs -- rather than accepting a blanket "inflation" adjustment, and compare each driver against the relevant benchmark for the specific part and origin. Pull cost decisions earlier into product development while designs can still change, price sourcing decisions on total cost of ownership including working capital, and qualify second sources before you need them.
Do tariffs help or hurt US manufacturers?
Both, depending on where a company sits in the value chain. Tariffs protect domestic primary producers -- US steel and aluminum mill-product prices are up 23-27% year over year -- but they raise input costs for every manufacturer downstream who buys those metals. Deere, for example, raised its 2026 earnings guidance while simultaneously projecting roughly $750 million in net tariff costs for the year.
Read more


Read more
Read more
Faster sourcing. Lower cost. Less chaos.
See how LightSource connects engineering, procurement, and suppliers in one operating system to help you launch faster at lower cost.
SOC 2
Kearney #1 2024
Gartner Cool Vendor
Procuretech 100
G2 Top Rated
Faster sourcing. Lower cost. Less chaos.
See how LightSource connects engineering, procurement, and suppliers in one operating system to help you launch faster at lower cost.
SOC 2
Kearney #1 2024
Gartner Cool Vendor
Procuretech 100
G2 Top Rated
Faster sourcing. Lower cost. Less chaos.
See how LightSource connects engineering, procurement, and suppliers in one operating system to help you launch faster at lower cost.
SOC 2
Kearney #1 2024
Gartner Cool Vendor
Procuretech 100
G2 Top Rated
Trusted by:
Trusted by:
Trusted by: